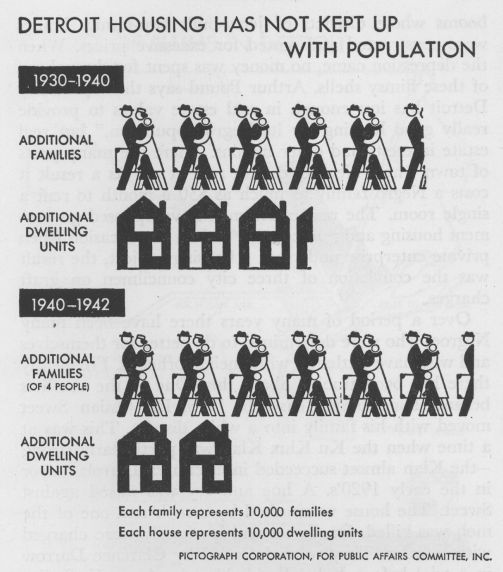
(28771) Detroit Housing Has not Kept Up with Population
Posted June 18th, 2012 by jruss
in
This chart appears on page 15 of a pamphlet entitled Why Race Riots? Lessons from Detroit, produced by the Public Affairs Committee and written by Earl Brown in 1944. The pamphlet examines the reasons behind Detroit's 1943 race riot. The pamphlet appears in the Reuther Library vertical file Race Riots 1940s folder.

Date:
1944Photographer:
Original Document- Login to post comments
- Thumbnail
- Printer-friendly version

 Reddit
 Facebook
 LinkedIn